IronTrade offers a lot of indicators that can be used together to improve their accuracy. However, try to keep it simple and do not put a lot of them at once! When you have more than 2 indicators on the chart, you may be easily confused with their outcomes and receive wrong signals. Before you start combining them, let’s understand their differences and how they can supplement each other. All indicators can be divided into 4 categories:
1. Trend indicators – they smooth out the chart and exclude minor fluctuations, so you can follow the trend line more accurately. Sometimes they are based on past performance of the currency pair and show the strength of a price trend. Usually, they are placed directly on a chart line.
2. Momentum indicators or oscillators help understand overbought and oversold levels and find reversal points of price. Usually, they are shown under the chart, so you will not confuse them with trend indicators.
3. Volume indicators – they show the volume of a traded asset. Understanding the volume is helpful to understand the strength of the price movement.
4. Volatility indicators show how much the price changes within a period. If the price is volatile, you can have more significant gains because of higher movement. Still, at the same time, you are exposed to a higher risk because of the same reason. So it is vital to understand the trend.
Now we will show you a couple of examples that may be applied in trading. All of the following indicators are available on IronTrade. If you want to combine several indicators, try to use them from different groups rather than of the same type.
RSI and Bollinger Lines
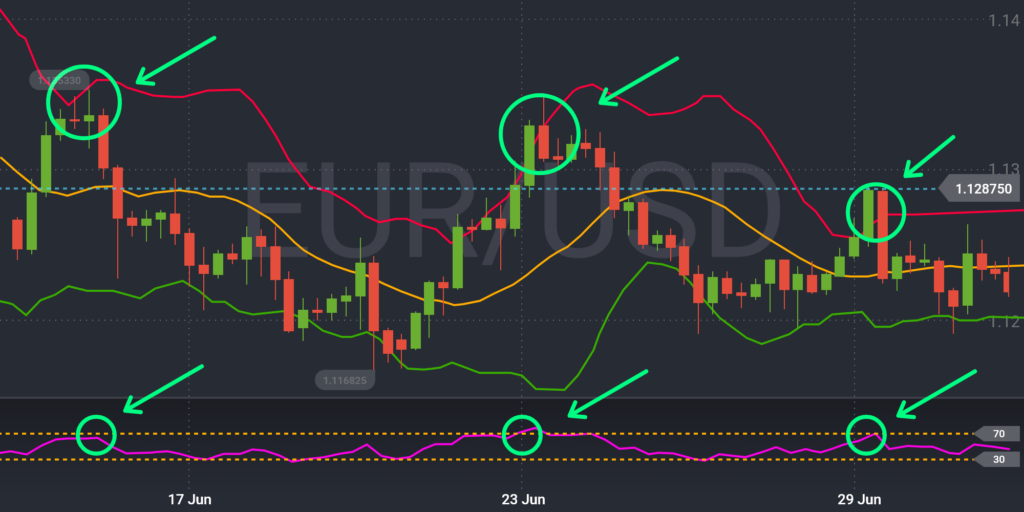
The RSI is an oscillator with the levels of 30 and 70 displayed on the chart. The chart fluctuates between 0 and 100. When the line crosses 70, it means that the asset is overbought, and when it crosses 30, it is considered oversold.
Bollinger Lines. This indicator shows the periods of high and low volatility. It has 3 different lines: moving average and two price channels above and below it. When the lines are wider, it means higher volatility and stronger movement.
How to use these indicators together? When candlesticks cross the bottom line of Bollinger Lines, and the RSI crosses the oversold levels and starts moving up, you can consider this as a signal for UP movement. When the chart crosses the upper line and the RSI is in the overbought level, you can consider this a signal for DOWN movement.

Picture 1. Both RSI and Bollinger Lines confirm a downward trend
Moving Average and Stochastic Oscillator
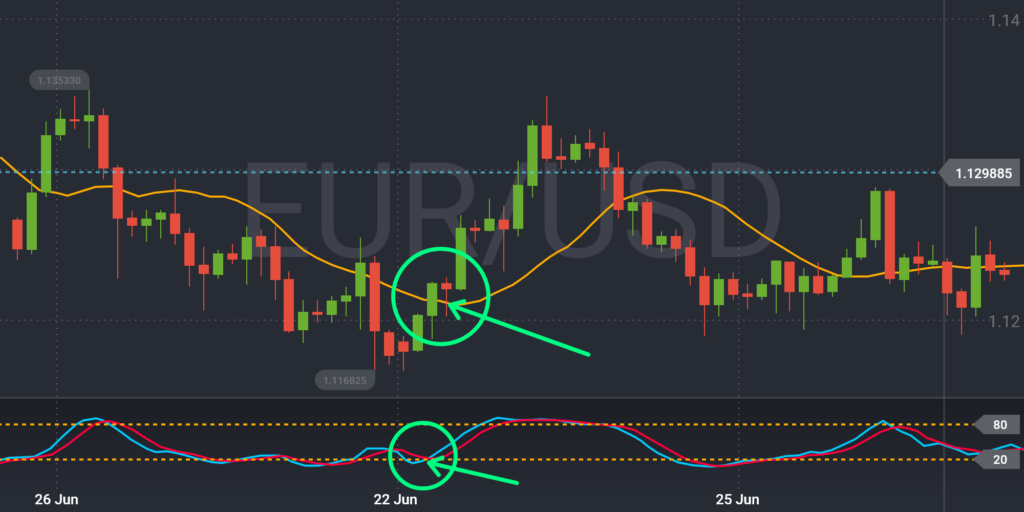
The Moving Average indicator is a primary instrument for any trader. By reducing the noise and smoothing the chart, it helps a trader to see the real market direction.
Stochastic is an indicator that shows overbought and oversold levels. It shows possible price reversals as well. It works excellent with Moving Average.
How to use them together? When the market crosses the Moving Average line upwards, and the blue line of Stochastic crosses the red line upwards, it indicates an UPTREND. Otherwise, when the market crosses the Moving Average line downwards, and Stochastic shows the blue line crossing the red line downwards, it indicates a DOWNTREND.

Picture 2. SMA and Stochastic indicate an upward trend
ATR and Parabolic SAR
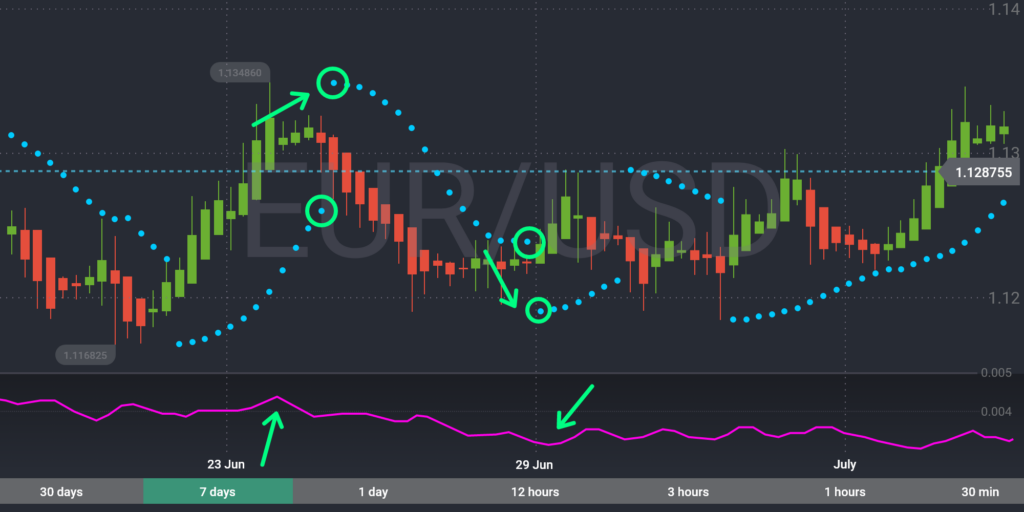
ATR indicates only volatility. It does not show the direction of a trend. It only measures how volatile the market. When the market is unstable, it shows potential trading opportunities.
Parabolic SAR is a trend indicator that helps traders find entry points during a trending market.
How to use them together? When the dotted line is below the price chart, it indicates the UPWARD trend. When the dotted line is above the chart, it indicates a DOWNWARD trend. When the Parabolic moves from one position to another, it is a good time to make a trade.
 Picture 3. Parabolic SAR indicates possible reversal points. ATR depicts periods of higher and lower volatility.
Happy end
Mixtures of technical indicators may be a robust analysis tool. Comprehending how to use it is very helpful for any trader. It is essential to understand that there is no indicator or mix of indicators that will deliver 100% valid signals all the time. Any indicator may show wrong signals periodically, which is why any trader should apply essential risk management strategies.
As usual, IronTrade wishes you all the best and good luck in trading! We hope that this post will help you a bit to understand trading.


