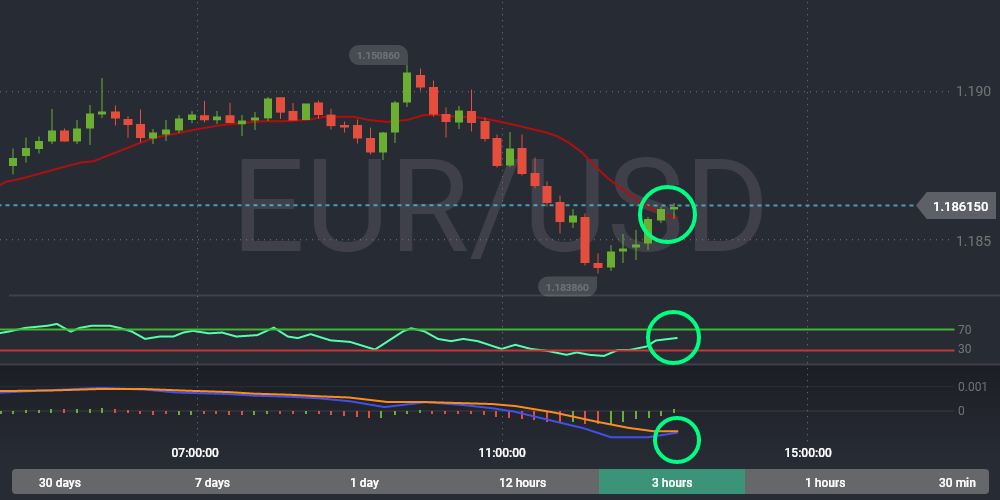
Any experienced trader on IronTrade uses their own mix of indicators, carefully chosen according to their strategy. However, some indicators suit almost any strategy or act as a perfect addon to each other. For example, RSI. It is widely used by traders of any level because it is simple and useful. You can integrate it with many other indicators. Today we will review how to combine it with the MACD and Moving Average indicators. It is handy for either short or long trades.
So, the RSI indicator
It is used to measure the trend’s strength and locate potential reversal points. It has a base line of 14 periods, overbought and oversold levels. Usually, these levels are set to 30 and 70. If you set these levels to 20 and 80, it will lead to a more calm approach and make the indicator less sensitive (which actually means stronger indications). However, let’s keep it as is for now. It depends on the traders’ strategy, but we recommend not changing it initially.
When the base line crosses the oversold level and continues to move up, it means that the price will be growing, and you need to invest UP. Otherwise, when the base line reaches the overbought level and continues downwards, it means to invest DOWN.
Ok, what’s about mixing them?
You have a perfect mixture of leading and lagging indicators when combining RSI, MACD, and Moving Average. RSI is a leading indicator showing potential future fluctuations and potential reversal points. Moving Average is a lagging indicator, which helps to confirm the signal. MACD indicates the strength of the trend and its direction. It is used to confirm the signals of the first two indicators.

How to understand the indicators?
For example, here, we have the base line of RSI higher than 50. It continues to move higher. The chart is crossing Moving Average from below and continues above it. The MACD indicator also gives an UPWARD signal because the blue line crosses the orange line upwards from below.
The conditions for the DOWNWARD signals are the following: the chart moves under Moving Average, the RSI base line moves towards the oversold level, and MACD shows red bars with the blue line crossing the orange one down.
Ok, how to set them up?
To enable all these indicators on IronTrade, you can click the gear icon and choose the “Indicators” tab. Then click the “+” sign near each necessary indicator and add it to the chart. You can leave default settings for now and experiment with them when you feel more comfortable with defaults.
Conclusion
These indicators complement each other well and provide solid and reasonable signals when used together. However! Remember that there are no indicators that guarantee 100% result. So, take your time and assess all the risks carefully before trading. Do proper risk management and practice on a demo account. Fortunately, you can do it on IronTrade for free at any time. Good luck!


